
Whether you lead a Fortune 500 division, sell handmade jewelry on TikTok or shoot threes in the NBA, it is essential to invest in building your own brand.
Where you live has always had an effect on your branding efforts. For decades, the surest way to “make it” in the field of your choice meant moving to New York or California, where legacy newsrooms, publishing houses, multinational corporations, investors, and advertising and PR agencies clustered.
While those ecosystems are still powerful, the proliferation of digital and social media platforms has given every American the chance to build their own brand, regardless of their physical location.
While being “in the mix” is still beneficial for exposure and networking, those hot spots tend to be expensive, which begs the question, “Is it still necessary?”
What’s the Best State to Build Your Brand
To find out the best and worst states to build your own brand in 2025, we used the most recent federal data to analyze eight key factors in all 50 states and D.C. across three main categories:
- Proximity to Media and Marketing: TV, advertising, PR and publishing jobs per capita.
- Income, Taxes and Business Costs: Average wage, state income tax rates, commercial rent per square foot and SBA loans per capita.
- Growth Potential: State net migration 2020-2024 and 2024 real GDP growth.
The complete methodology with links to all sources is at the bottom of the study.
Key Findings
- Washington is the No. 1 Best State to Build Your Brand. Has the nation’s second-highest concentration of publishing and broadcast jobs – which offers a lot of opportunity to network and receive third-party promotion. The state also boasts high incomes and no state income tax.
- Florida Ranks No. 2 on the Strength of Migration. More Americans have moved to Florida than any other state since 2020 (89.7 net migration rate per 1,000 residents), making it a hot spot for current and future brand building.
- Zero State Tax Beats Legacy Hubs. Texas, Florida, and Nevada all make the top 10, while California lands outside the leaders because of high state taxes, high rents and significant negative migration.
- Hawaii is the Worst State to Build Your Own Brand: High rents, steep taxes, below-average networking opportunities, negative migration and the lowest SBA lending volume in the U.S. make it hard for creators and businesses to scale.
- Heartland headwinds. Mississippi, Iowa and Kansas also appear in the bottom 10 despite low rents, largely because they lack creative-industry infrastructure and outside capital.
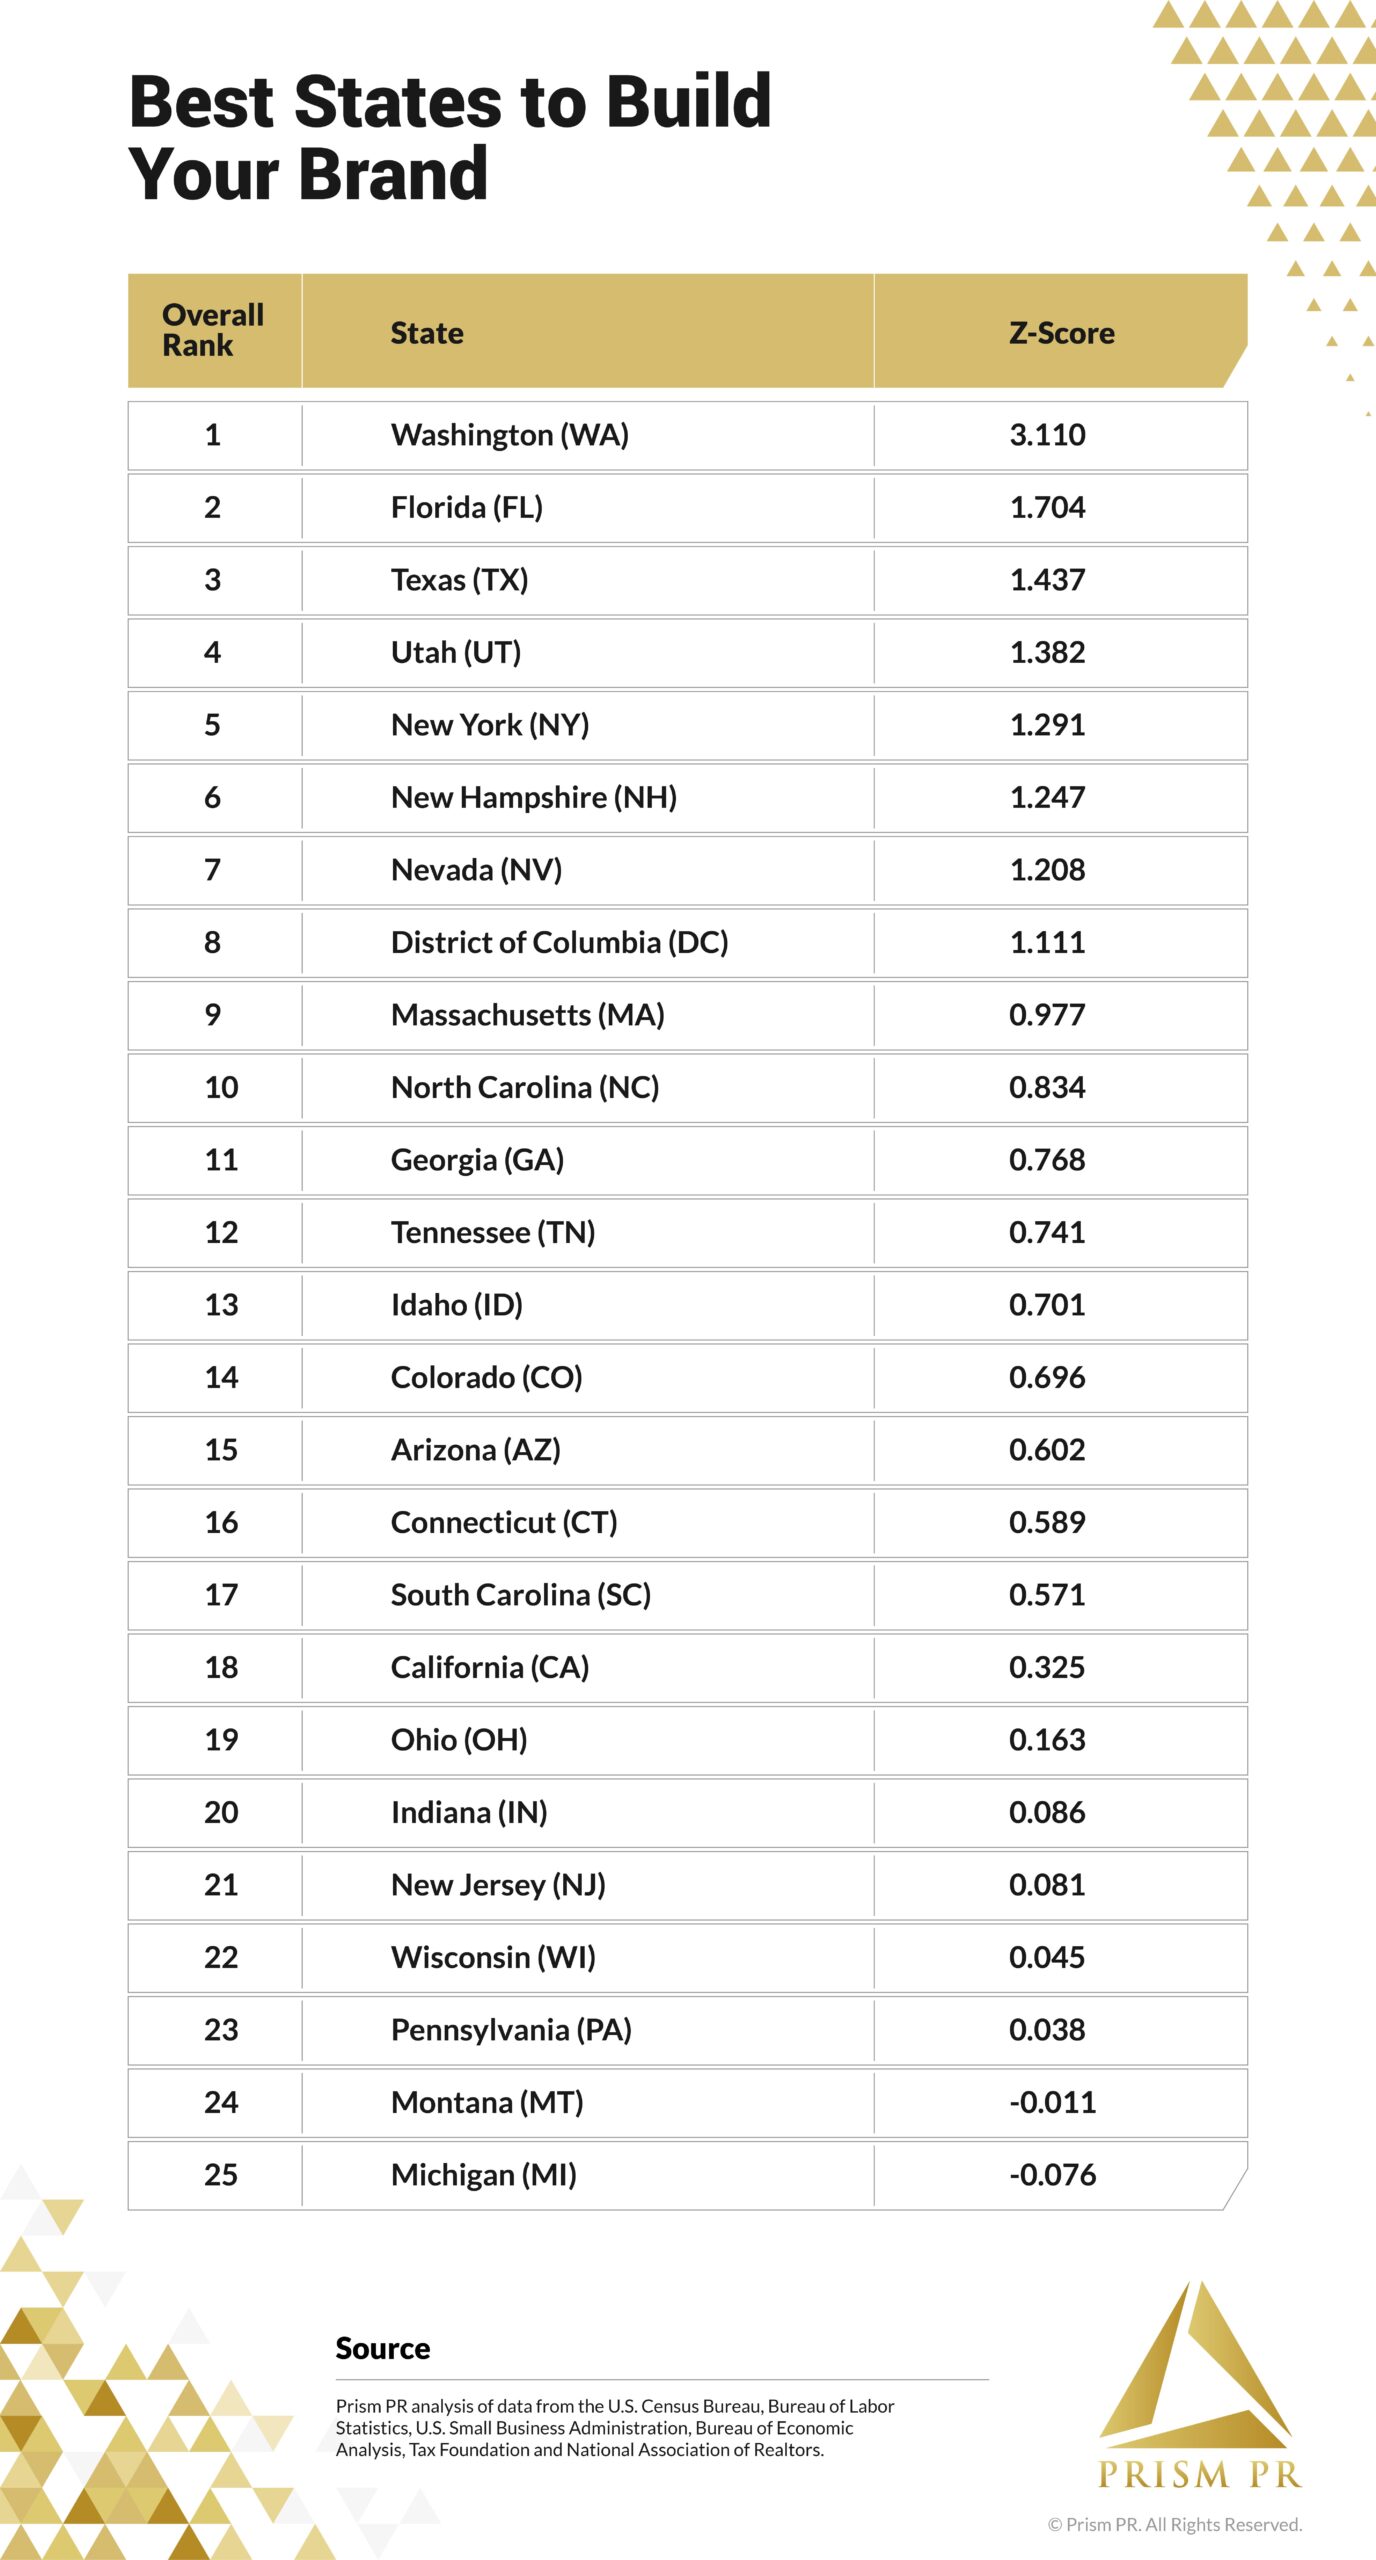
Best States for Building a Personal Brand
Three states rise above the pack because they combine dense creative labor markets, tax or cost advantages and steady inflows of new residents. Those forces give professionals more chances to collaborate, reach bigger audiences and keep more of what they earn.
Washington — No. 1 Overall
Washington sits at the intersection of tech, media and the arts. The state packs 499 publishing and broadcasting jobs per 100,000 residents, second only to Washington, D.C., and tops the nation with the arts accounting for 9.8% of GDP. Individuals keep more of their high income because the state levies no personal income tax. Migration also runs positive at 24.0 newcomers per 1,000 residents since 2020, expanding local networks and customer bases. When brand builders need capital, they find it: lenders made $12.1 million in SBA 7(a) loans per 100,000 residents last year, the fourth-highest figure in the country.
Florida — No. 2 Overall
Florida’s superpower is audience growth. Since 2020 the state has gained 89.7 net newcomers per 1,000 residents, by far the highest rate in the nation. That influx fuels fresh demand for content, products and professional services. Zero state income tax and comparatively moderate commercial rents of $20.85 per square foot help professionals, entrepreneurs and creators reinvest. Although Florida’s creative job density trails Washington’s, the state still supports 93 publishing and 120 advertising jobs per 100,000 residents. A 3.6% real GDP gain in 2024 shows that the broader economy is keeping pace with population growth.
Texas — No. 3 Overall
Texas blends a pro-business climate with a rapidly diversifying economy. Like Florida, it forgoes personal income tax and posts strong in-migration at 53.8 per 1,000 residents. Its metro areas—Austin, Dallas and Houston—act as magnets for tech talent and media firms. The state’s SBA lending ranks 10th, and average commercial rent, at $17.67 per square foot, undercuts every legacy coastal hub.
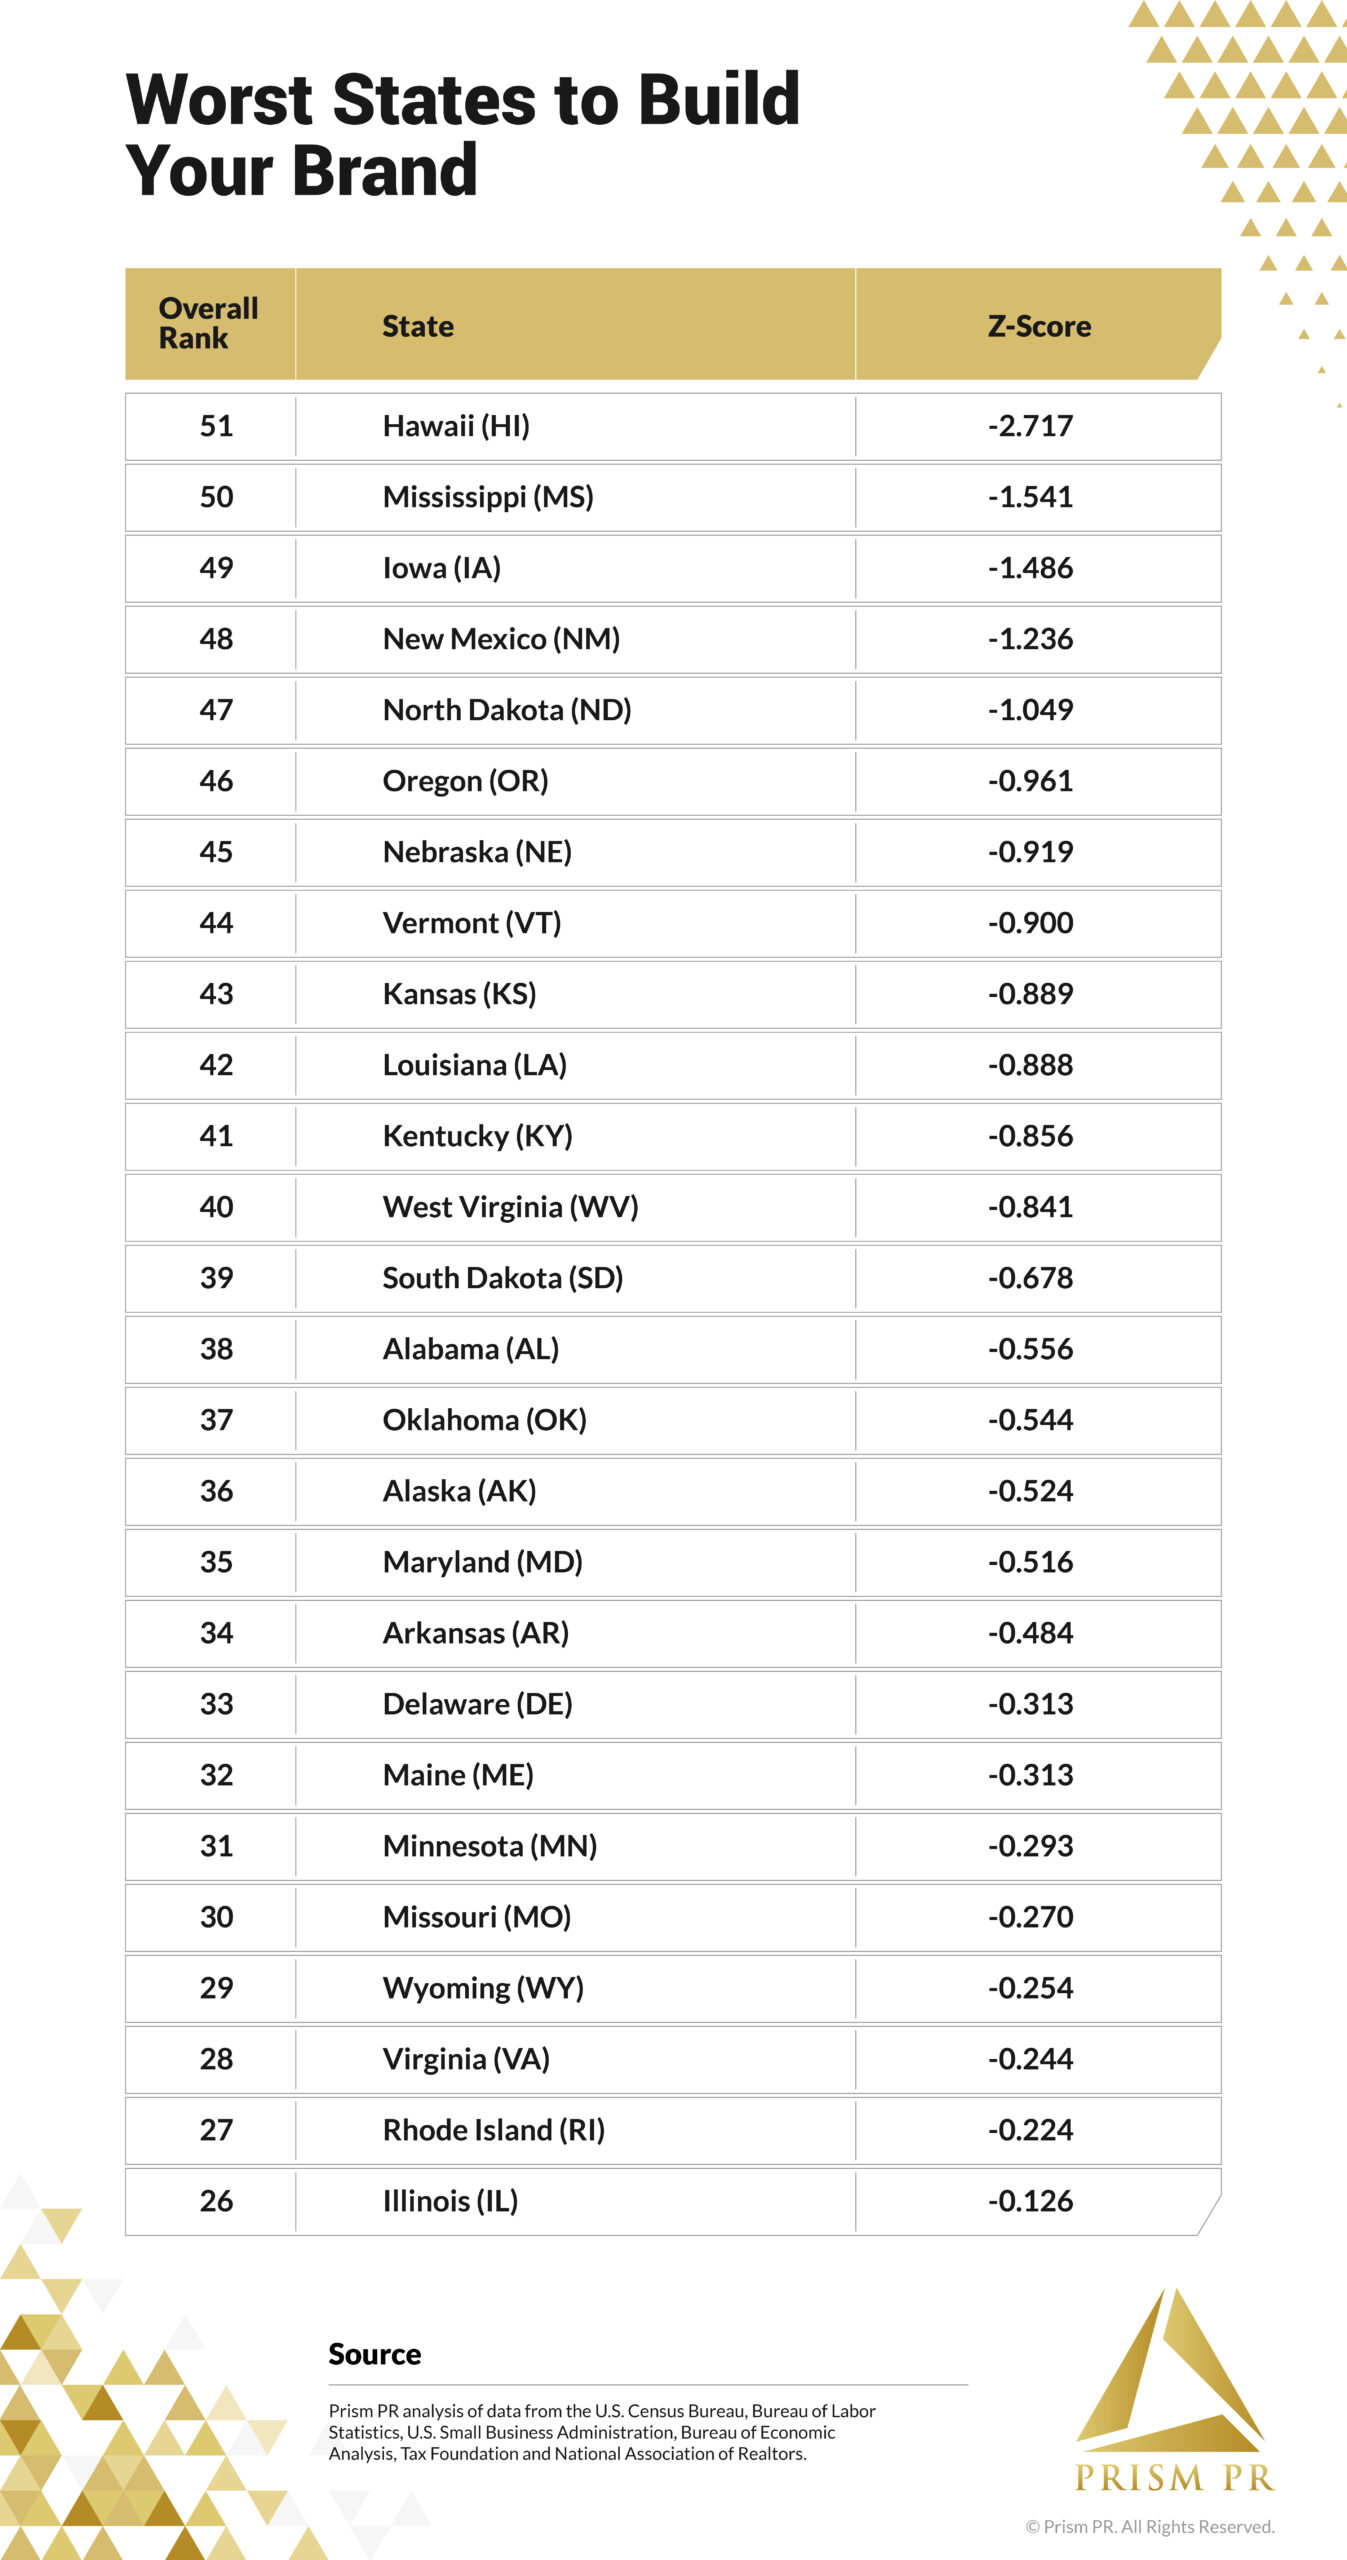
Worst States for Building a Personal Brand
Three states sit at the bottom of our ranking because they mix high costs, weak creative ecosystems and limited access to capital.
Hawaii — No. 51 Overall
Hawaii’s scenery cannot offset its overhead. Commercial rent averages $36 per square foot, nearly double the national median. The state hosts only 52 publishing and broadcasting jobs per 100,000 residents, and net migration was a negative -13.76 per 1,000 since 2020, shrinking local networks. SBA 7(a) lending was lowest in the nation at $3.8 million per 100,000 residents, while a 7.6% state income tax clips take-home pay.
Mississippi — No. 50 Overall
Mississippi offers cheap commercial rental space at $14.67 per square foot but little creative infrastructure. The state ranks last in average wages and publishing employment, and arts add only 1.8% to GDP. Net migration runs negative, and SBA lending lags most of the country, leaving few investors to fund growth.
Iowa — No. 49 Overall
Iowa pairs moderate media density with an economy that shrank 0.5% last year, the second-worst result nationwide. Arts output claims just 2% of GDP, and SBA lending remains near the bottom. Although migration is slightly positive, inflows trail the rates that power top-ranked states. Limited capital and a small creative workforce keep many personal brands from scaling.
DATA WRAPPER – INTERACTIVE CHART
Creative Density and Networking Potential
Publishers, broadcasters and ad agencies form the talent clusters that help personal brands network and gain traction. We scored each state on three signals that measure this ecosystem:
- Publishing and broadcasting jobs per 100,000 residents
- Advertising and public relations jobs per 100,000 residents
- Arts and culture share of state GDP
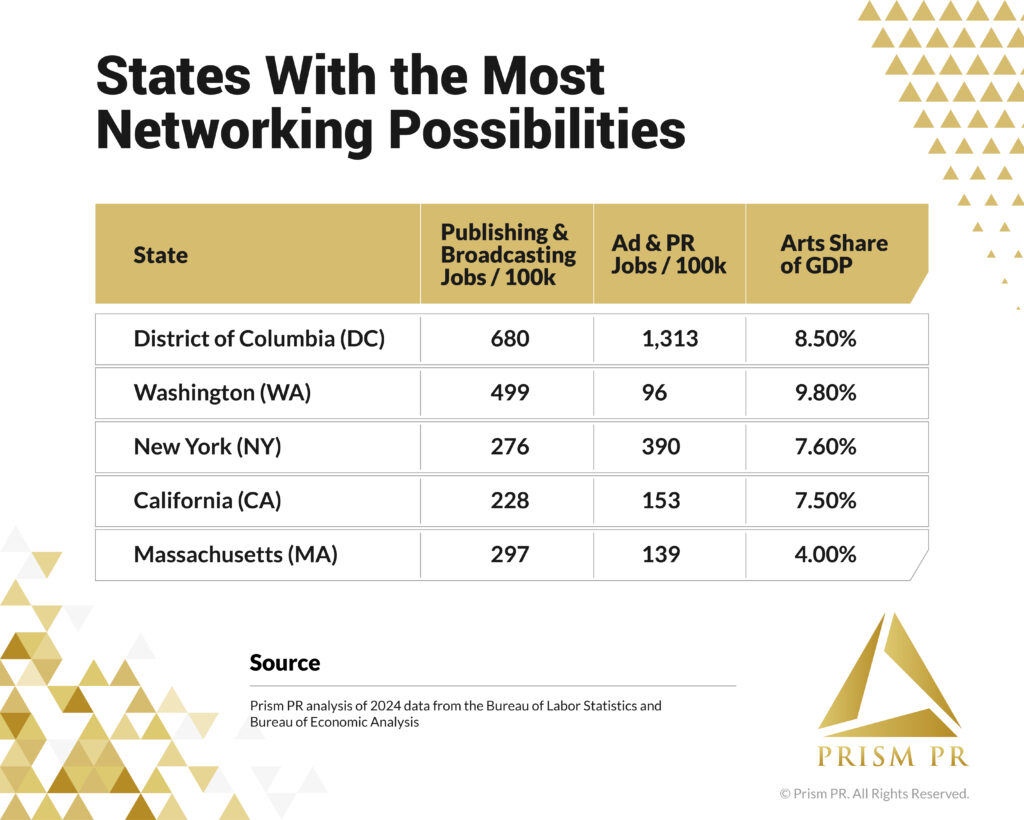
The winners host deep creative labor pools and a visible arts economy. Washington, D.C. leads by a wide margin with 680 publishing jobs, 1,313 ad and PR jobs per 100,000 residents and an 8.5% arts GDP share. Washington state follows, pairing the nation’s highest arts output (9.8% of GDP) with strong media employment. New York, California and Massachusetts round out the top five thanks to their longstanding media and agency hubs.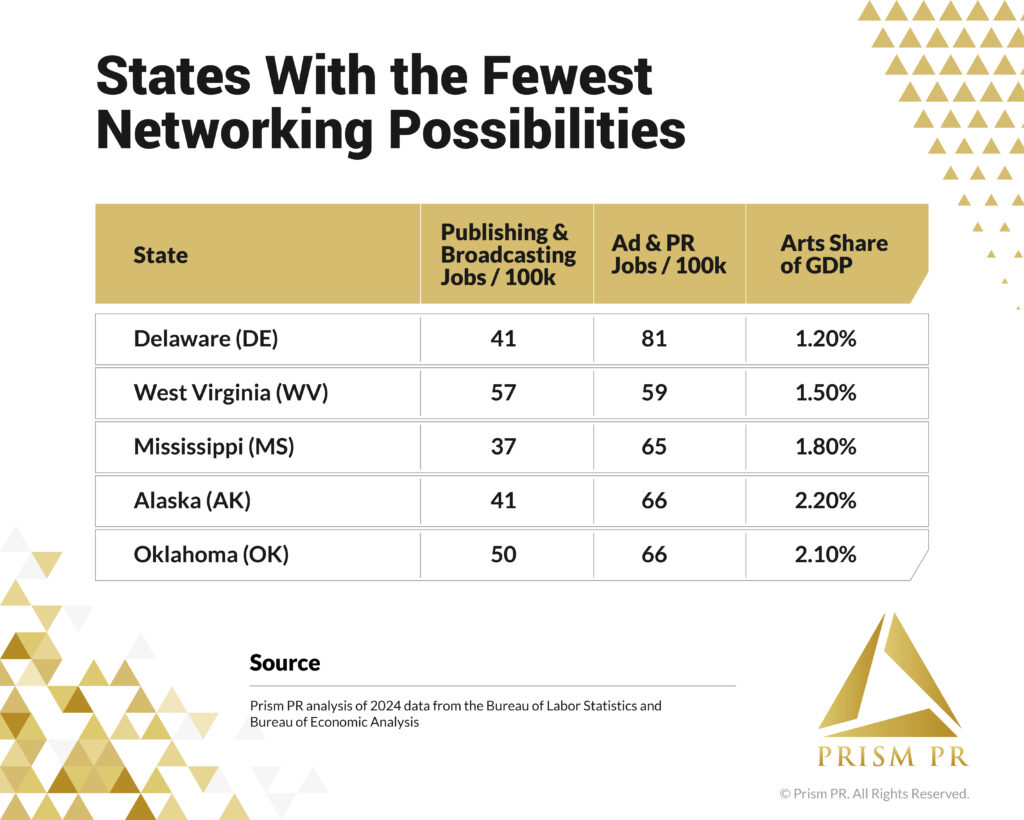
At the other extreme, thin creative networks make brand building harder. Delaware, West Virginia, Mississippi, Alaska and Oklahoma show media job densities one-tenth of D.C.’s and arts GDP shares below 2.3%, limiting collaboration and exposure opportunities.
Growth Potential
To measure growth potential, we tracked two forward-looking signals: net migration, which shows whether people are moving to or leaving a state, and real GDP growth, which reflects the pace of local economic activity.
New York and California, the states that were the traditional hubs for people seeking to make a name for themselves, are no longer as popular as they once were. While 44 of the 51 states and D.C. experienced positive net migration between 2020 and 2024, New York and California experienced significant negative migration. New York was the top state losing residents, with a negative net migration rate of -22.12 per 1,000 people. California was in 4th place with a negative net migration rate of -13.42 per 1,000 people, falling behind only Louisiana and Hawaii.
So why are people moving? When surveyed, 61% of New York City residents say it’s increasingly difficult to pay for basic needs, and almost half say they’ve considered leaving because of mounting financial pressure. Residents who move do so in search of lower costs and new opportunities.
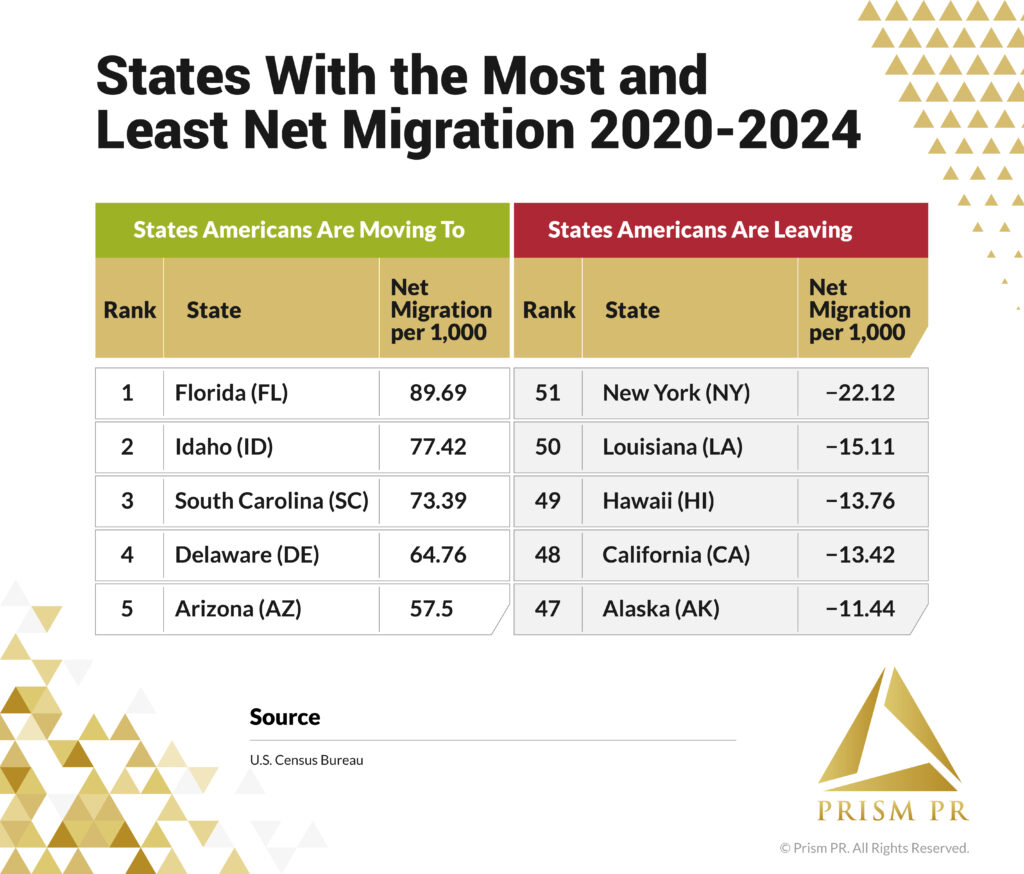
States that capture these movers stand to gain larger consumer bases, more diverse talent pools and stronger entrepreneurial ecosystems, all of which make it easier for professionals to grow an audience and form partnerships. Florida led the nation with an in-flow of 89.7 newcomers per 1,000 residents from 2020 to 2024. Idaho, South Carolina, Delaware and Arizona also posted double-digit gains.
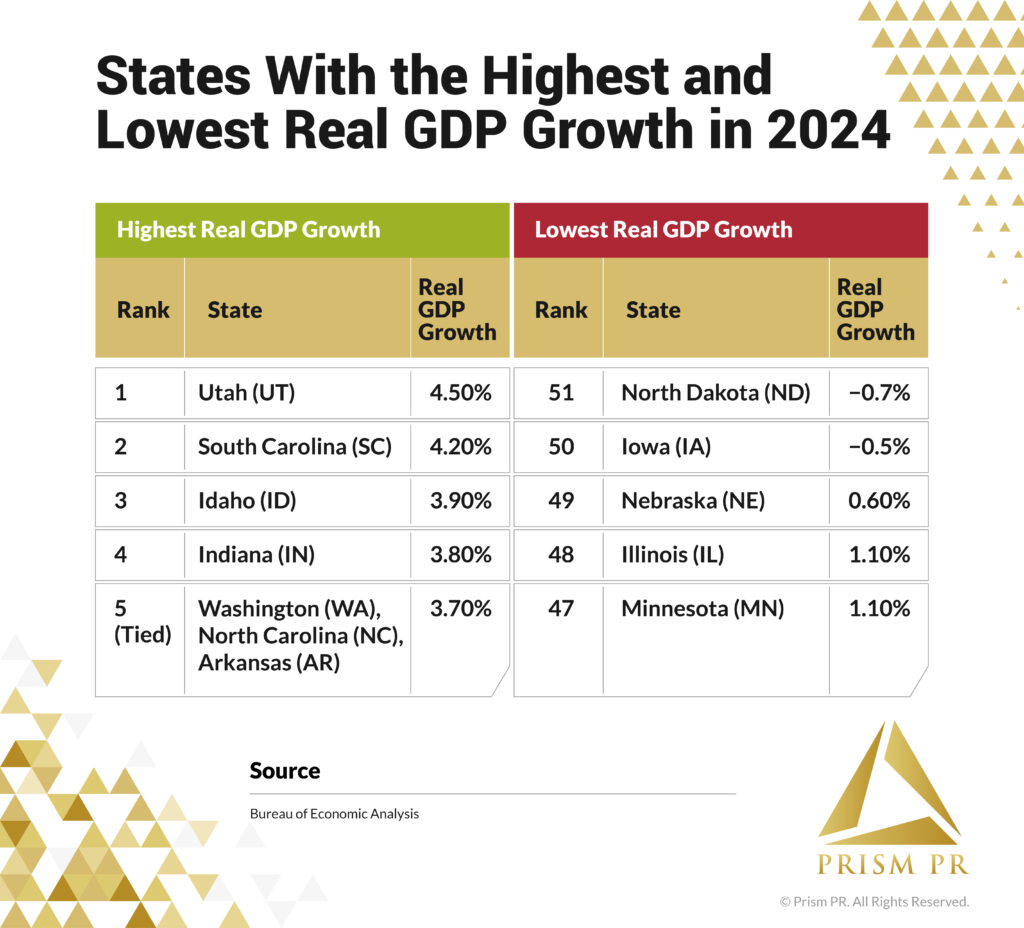
Strong output growth signals rising household income and business confidence. Utah set the pace in 2024 with a 4.5% real GDP gain, followed by South Carolina at 4.2% and Idaho at 3.9%. Expanding economies help brands and businesses grow and sustain demand for goods and services.
North Dakota and Iowa were the only two states whose real GDP shrank in 2024. North Dakota’s economy fell by 0.7% and Iowa’s by 0.5%. Nebraska, Illinois and Minnesota are ranked next lowest, with positive but low real GDP growth.
Income and Business Costs
Higher earnings and lower overhead make it easier to invest in better content, attend industry events and weather slow months without diluting your brand. We looked at four levers that directly hit a professional or business owner’s bottom line: wages, state income tax, commercial rent and access to capital through SBA loans.
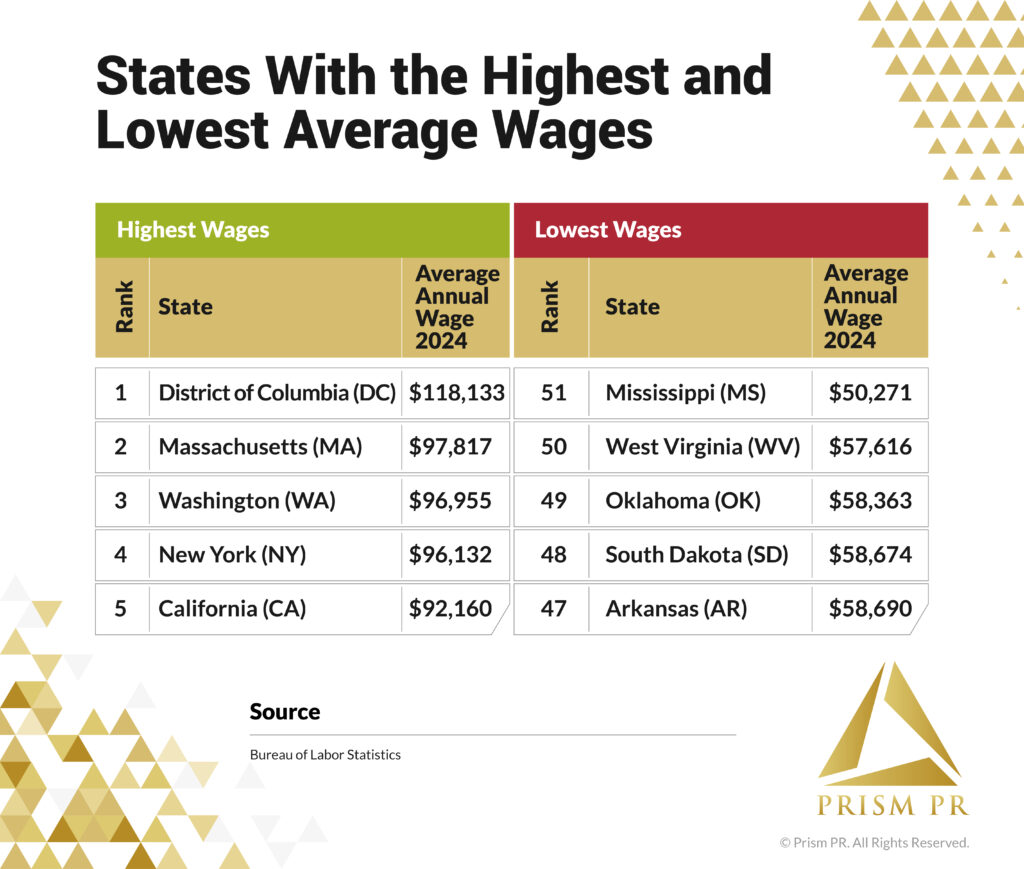
A strong salary base puts more money behind creative projects and paid promotion. While certain costs, such as rent and food, may also be more expensive in areas with higher incomes, other expenses, such as equipment or hiring help online, will usually cost around the same no matter where you live. This gives those in high-income states an advantage.
The District of Columbia leads with an average wage of $118,133, followed by Massachusetts, Washington, New York and California. At the opposite end, Mississippi’s $50,271 average wage may leave little disposable income for quality production or outside help. West Virginia, Oklahoma, South Dakota and Arkansas also all come in under $59,000.
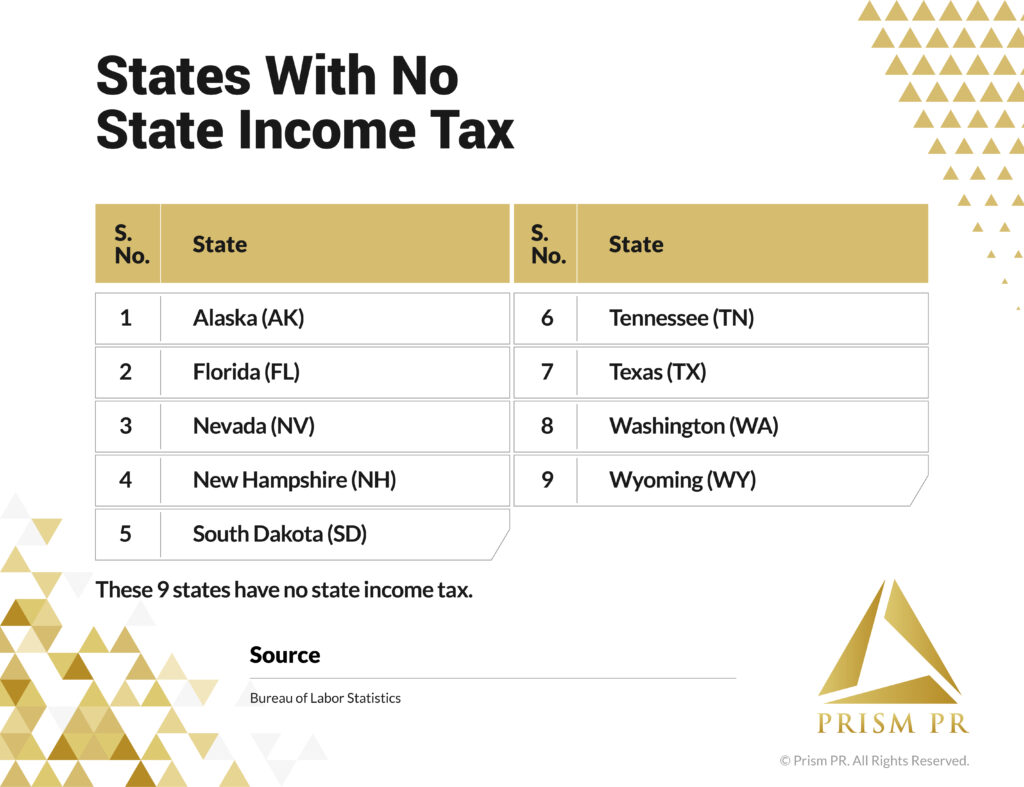
A state’s tax policy will also have an effect on disposable income for branding efforts. Nine states, including Florida, Texas and Washington, impose no personal income tax. Washington is especially relevant because it also has the third-highest average income in the U.S., which is one of the reasons why it placed number one in our overall ranking.
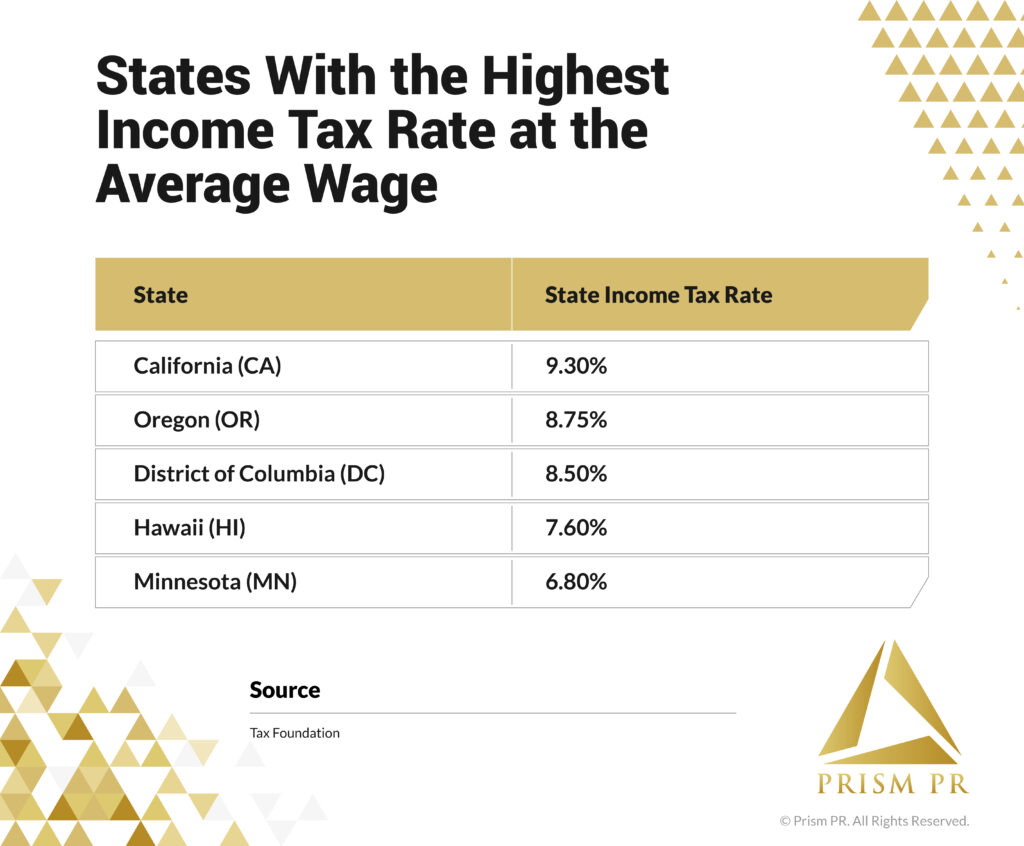
In contrast, California’s highest in the nation 9.3% bite at the average wage brings down its score despite relatively high average salaries. Oregon, D.C., and Hawaii have the next highest taxes at the average wage with 8.75%, 8.50% and 7.60% respectively.

Workspace costs shape everything from studio quality to in-person collaboration. Hawaii sets the national high at $36 per square foot, trailed closely by California and D.C.. Kansas and West Virginia share the lowest average of $12.33, giving small agencies and solo creators room to expand without a massive fixed cost. Ohio, Wisconsin and Montana all hover between $13 and $14, letting residents reinvest savings into better gear or ad spend.
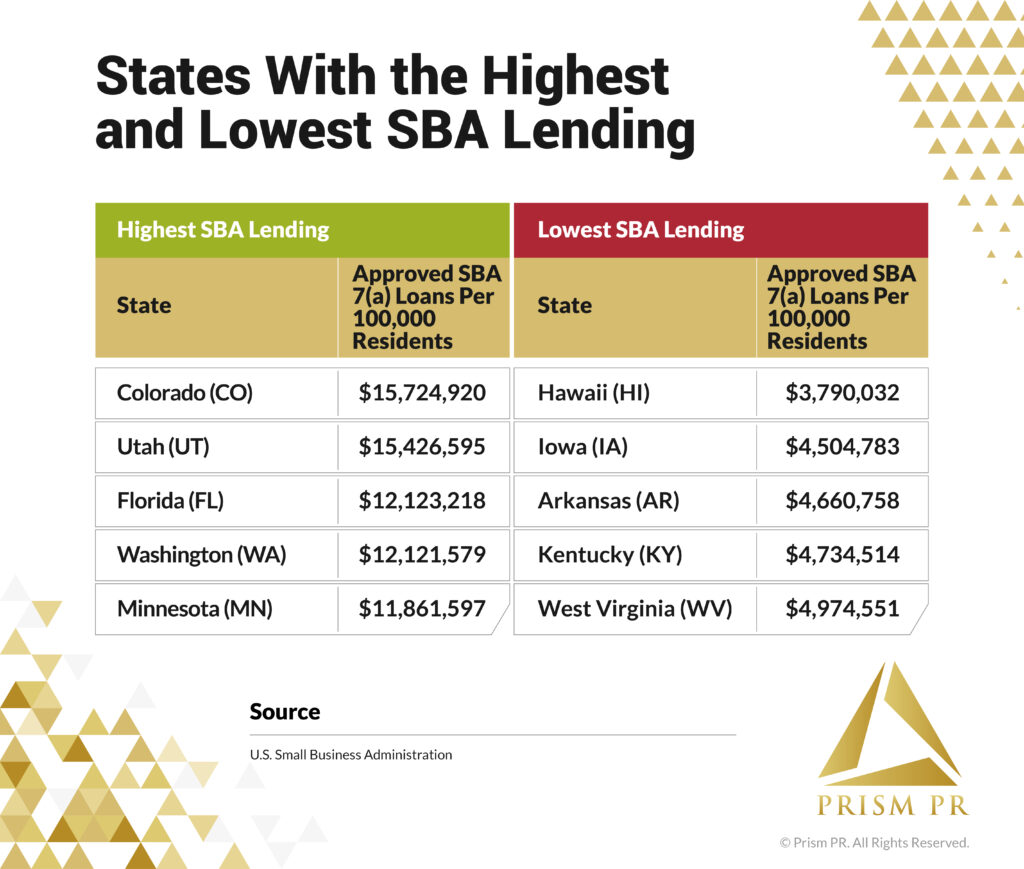
Affordable capital bridges the gap between vision and execution. Colorado recorded $15.7 million in SBA 7(a) approvals per 100,000 residents last year, edging Utah’s $15.4 million. Florida and Washington each secured about $12.1 million.
In contrast, Hawaii’s $3.8 million and Iowa’s $4.5 million show limited credit flows. When traditional lenders hesitate, creators must rely on personal savings or high-interest alternatives, slowing growth and raising risk if projects don’t pan out.
Methodology
We created our state ranking by comparing the most recent available data for 9 key statistics related to building a personal brand. State population data from the U.S. Census Bureau was used to find rates per 100,000 residents, where applicable. The datasets were then standardized through Z-score distributions and all outliers were capped at 2. The data for each state was averaged to produce a final score. Here are the data categories and sources:
Creative Density and Networking Potential
- Publishing and Broadcasting Employment per 100,000, Third Quarter 2024 — Bureau of Labor Statistics, QCEW NAICS 519, NAICS 513 and NAICS 516
- Advertising and PR Employment per 100,000, Third Quarter 2024 — Bureau of Labor Statistics, QCEW NAICS 5418
- Arts and Culture Share of State GDP, 2023 — Bureau of Economic Analysis
Growth Potential
- Net Migration per 1,000 Residents, 2020-2024 — U.S. Census Bureau
- Real State GDP Growth, 2024 — Bureau of Economic Analysis
Income and Business Costs
- Wages per Employee, 2024 Annual Averages — Bureau of Labor Statistics
- State Income Tax at the Average Wage — Tax Foundation, State Individual Income Tax Rates and Brackets, 2025
- Average Commercial Rent per Square Foot, Second Quarter 2024 — National Association of Realtors
- SBA 7(a) Loan Dollars Approved per 100,000 Residents, Fiscal Year 2024 — U.S. Small Business Administration